Late frosts risk evolution in Walloon forests with climate change
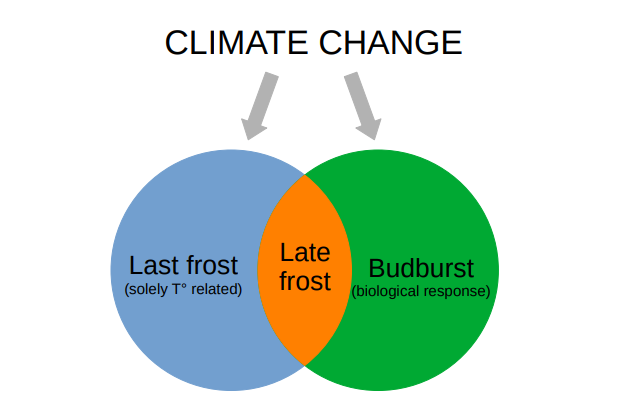
During my thesis, I was interested in predicting how the risk of late frosts will evolve in the context of climate change for Walloon forests. Late frosts, also called spring frosts, are frosts that occur after budburst (unfolding of leaves, fruits and flowers in spring) when trees are particularly sensitive. Unexpectedly, climate change, although primarily a warming, has the potential to increase the risk and damages from such events. Indeed, not only climate change acts on frost (purely in terms of temperature) but also on the timing of budburst because the trees try to take advantage of warming by making their budburst earlier in the year. Therefore, an increasing risk of late frosts is not incompatible with global warming. In fact, some scientific studies predict an increased late frosts risk in certain regions of the world even if these regions will face a warming! In the end, late frost risk evolution depends on the relative advancement of the last frost of the year date and the burdburst date. If the last frost date is brought forward slower than that of bud burst, then the trees find themselves at a stage of development that is too advanced (compared with the surrounding temperature) and the risk of potentially damaging late frosts increases. To sum up, climate change affects two elements, one wich tends to increase the risk while the other one tends to decrease it. The question is which one is dominant.
Anyway, I will not detail here the scientific study nor its data, methodology, results and discussion. All these elements, supported by a scientific basis can be found in the thesis here if you are interested. The main objective of this page is to present some of the figures that have been produced using a strong automation of data processing with the help of a programming language (R in this case). Obtaining these results required, among other things, hundreds of simulations and calls to a model, hundreds of data processing, sometimes with tens of millions of values... this would not have been possible by hand of course. Therefore, this page must be seen as a showcase of my data visualization and computer skills, and not as a summary of the thesis. Since the final script is thousands of lines of code and that the data and models can't be shared due to a strong NDA, the code will not be shared.
Historical frost evolution
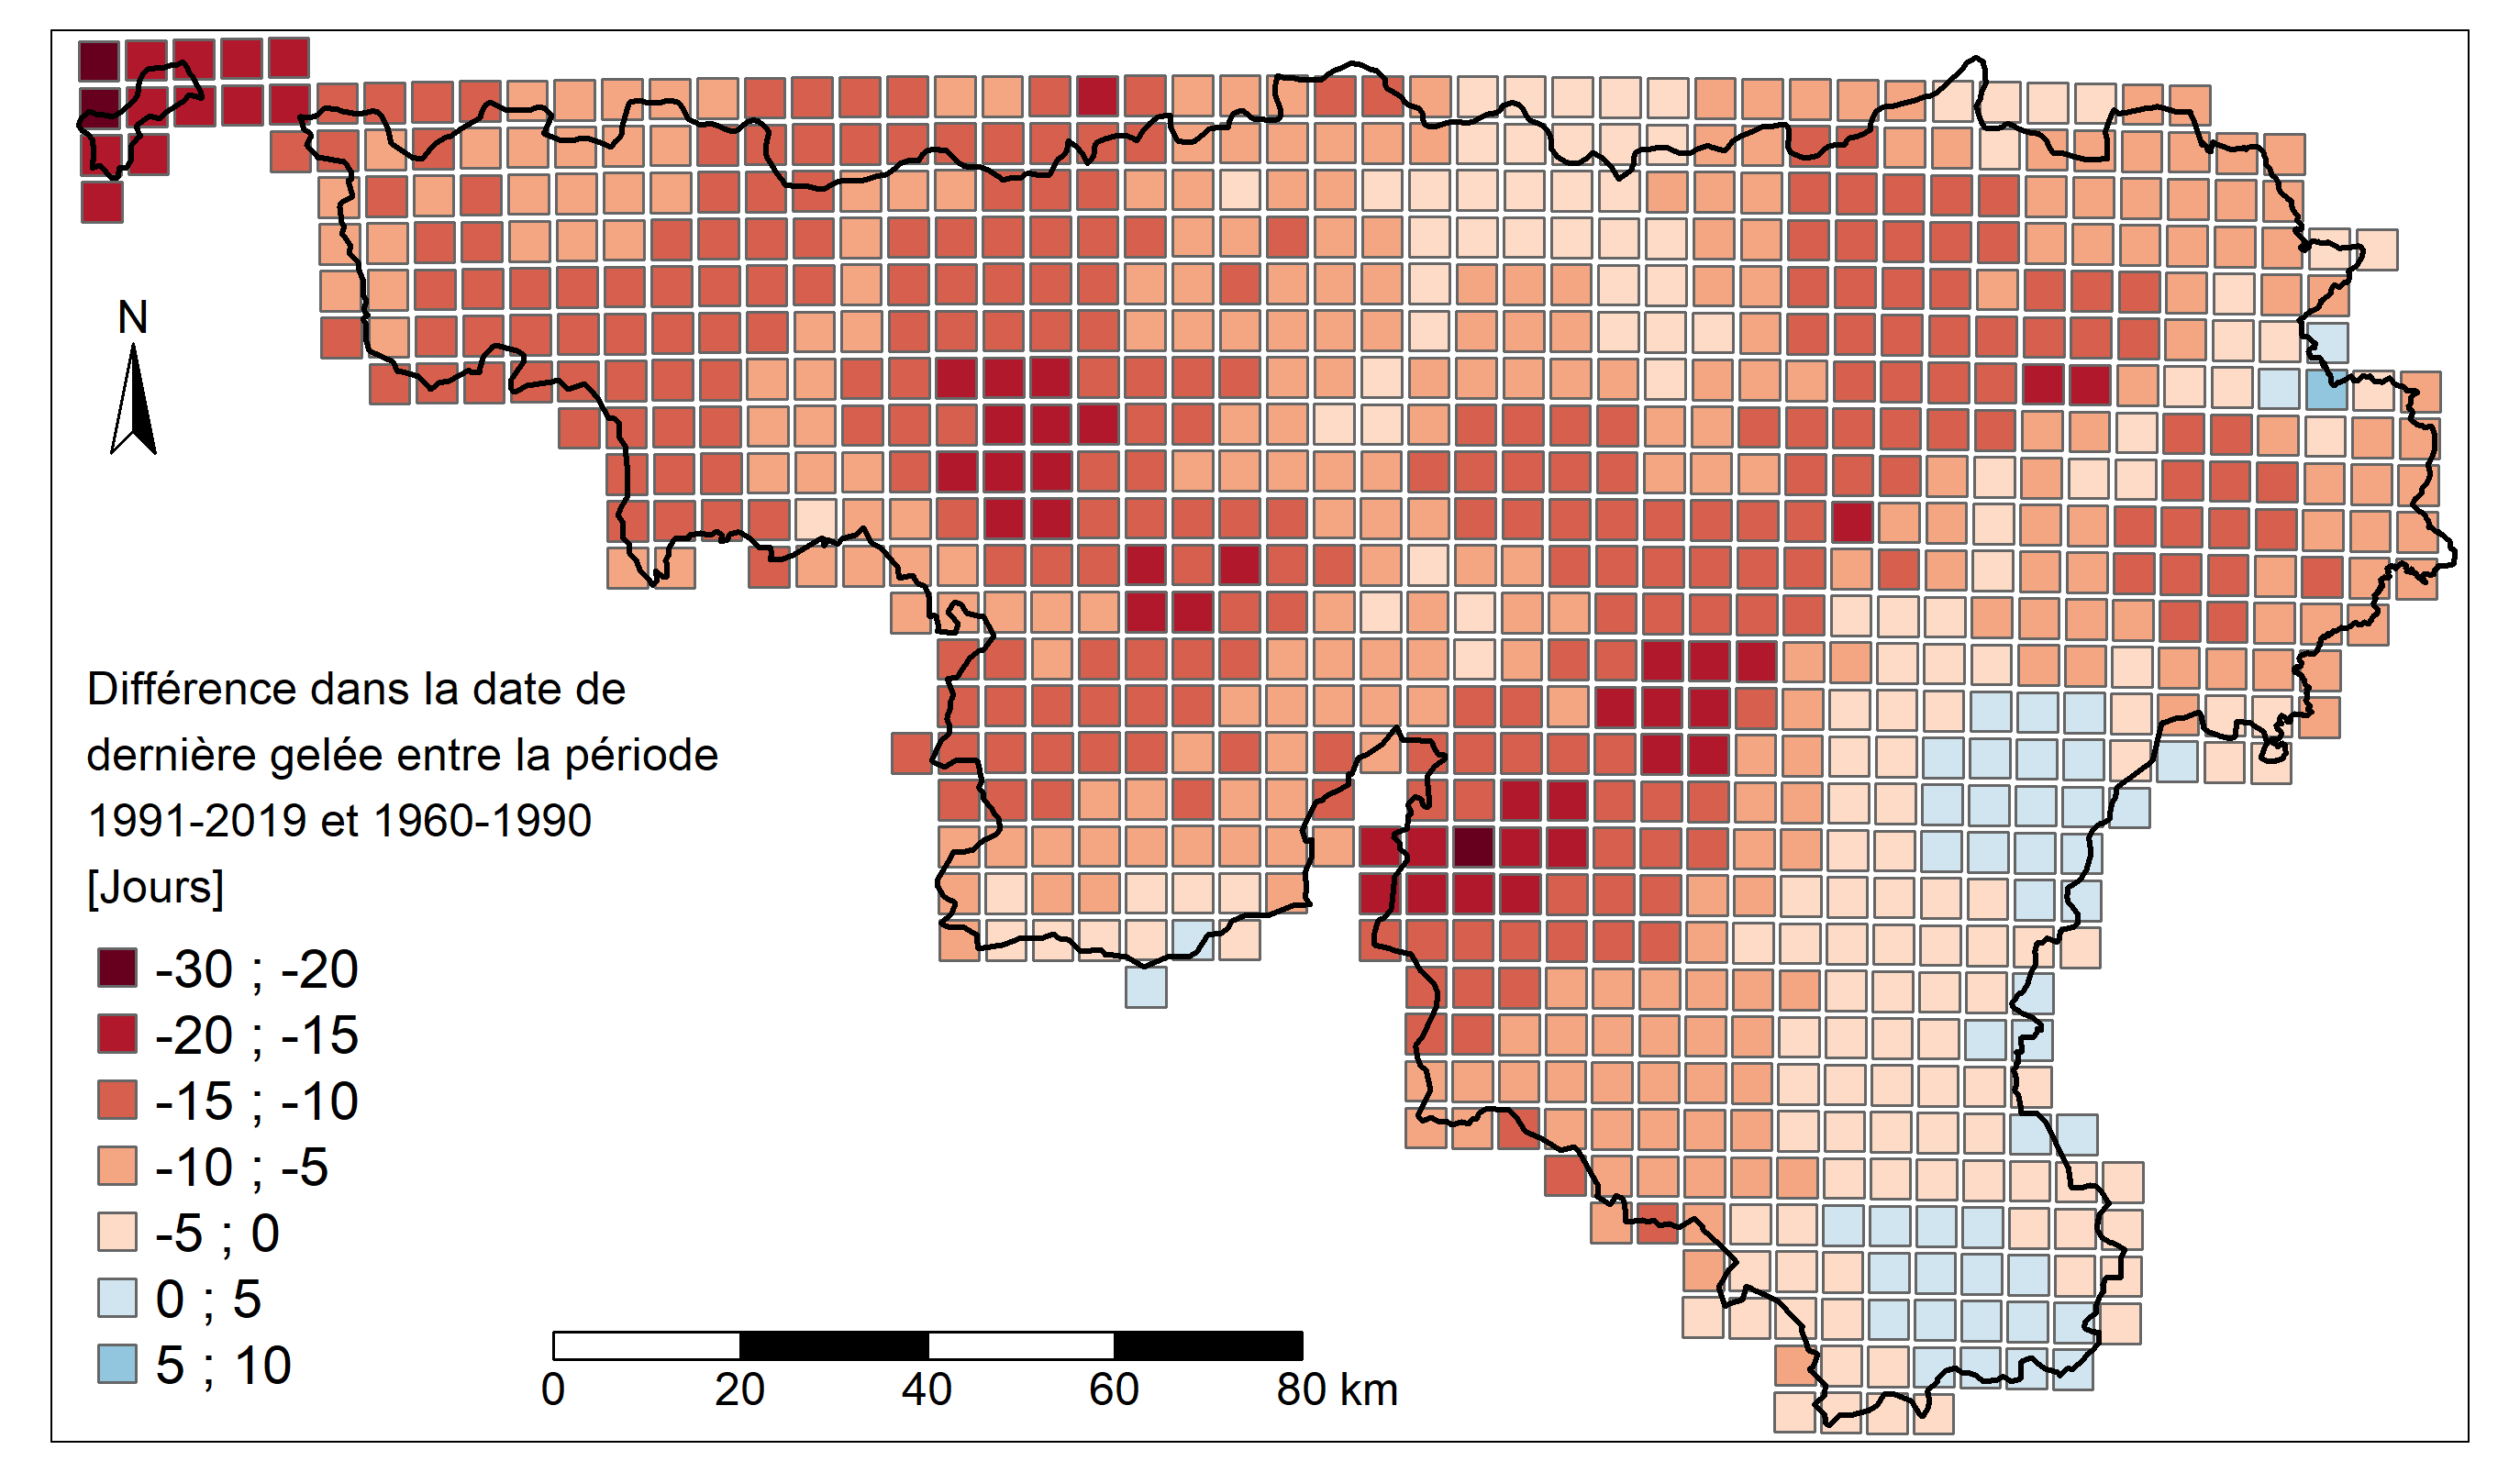
The first figure shows the difference in date of the last spring frost (temperature below 0°C) between the period 1991-2019 and the period 1960-1990 [Days] (source of raw data: IRM, 2018). Positive (negative) values indicate a later (earlier) last frost date. Unsurprisingly, the general trend is toward an advancement in the year of the last spring frost (8.4 days on average). A few exceptions are notable in Eastern Wallonia. It should be noted that this variable is partially correlated with the evolution of the average temperature. However, extreme events, such as the last frosts of the year, are also affected by changes in temperature variability and distribution. This map therefore provides information that would not be visible with the evolution of the average temperature!
Model Validation
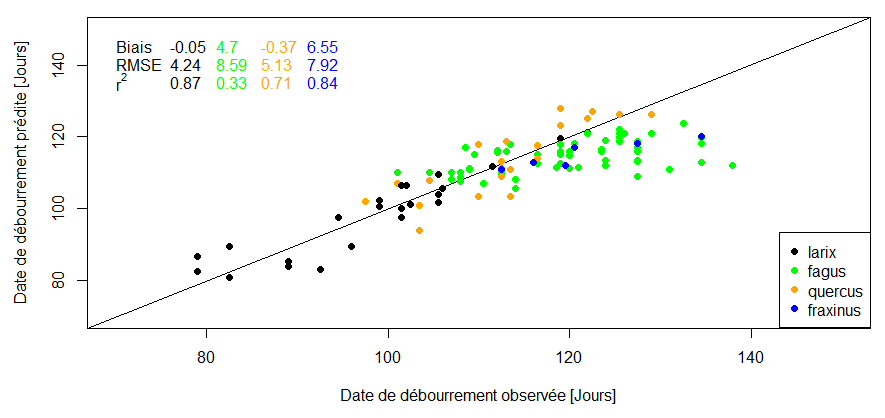
As I was interested in projections of the future, models were needed. Of course, an important element in the construction and use of models is their validation by comparing results with real observations. The following figure shows predicted budburst dates as a function of observed budburst dates [days], for four different tree species. It is clear that the model works well for some species (larix and quercus) with good visual grouping of points around the x=y line and good validation indices. However, the results are less good for the Fagus species for which the model seems to lack sensitivity. The number of observations of Fraxinus species was insufficient to draw firm conclusions.
Simulated historical late frosks risk evolution
To assess the risk of late frosts, different indices can be calculated. For example, the safety margin (SM_LT50) is defined as the difference between the minimum temperature after bud burst and a lethal temperature threshold (below which 50% of the leaves are damaged; a tree species specific value) [°C]. A negative safety margin indicates at least one late frost episode in the year. The lower the value, the more harmful the freeze event. Here is represented the evolution of the safety margin between 1961 and 2019 [°C/year] as simulated for ash species. A star indicates a statistically significant linear trend (p-value < 0.05). The simulations mainly indicate an increasing safety margin during this period and therefore a decreasing risk of late frosts.

Projections for futur late frosks risk evolution
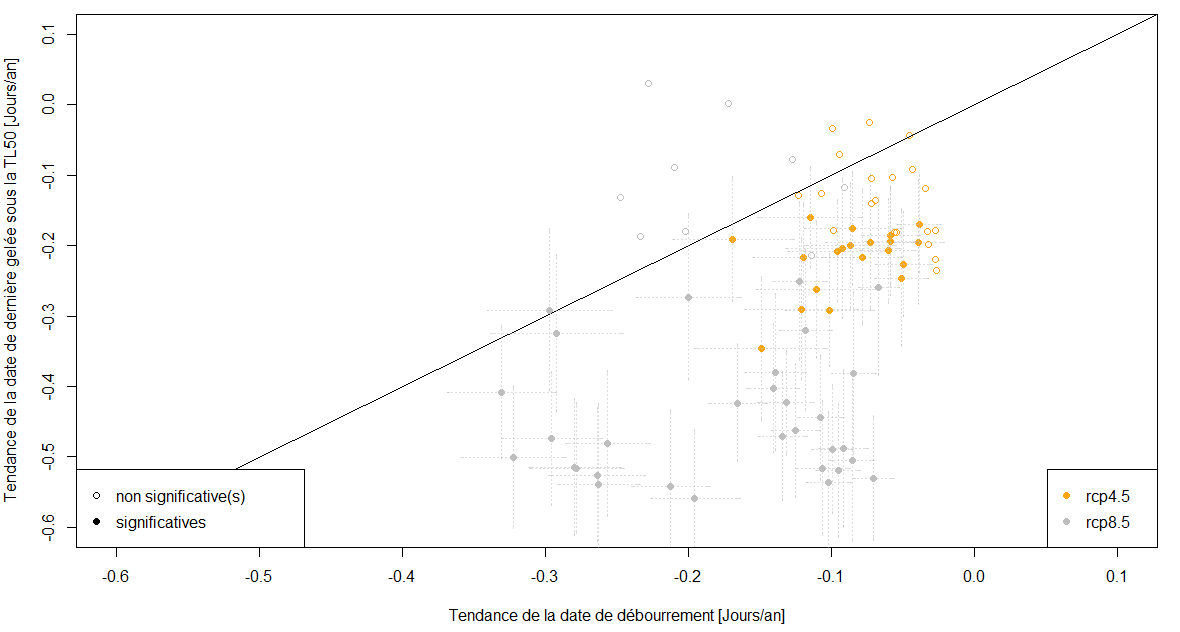
Predicting the future evolution of the risk of late frosts was the main objective of the thesis. Even considering many uncertainties, the results point to a decrease in the risk of late frosts in Walloon forests with climate change. These results are reflected in the following figures, each emphasizing different variability factors. The first figure compares the evolution of the date of budburst [days/year] with the evolution of the date of the last frost (temperature below LT50) [days/year] between 2006 and 2100 on the basis of climate projections made by two different models and forced by two different warming scenarios (RCP 4.5 and RCP 8.5). Open dots indicate that at least one of the two trends was statistically nonsignificant. Full dots indicate that both trends were significant (p-value < 0.05). The dotted lines represent the standard error of regressions. It is clear that most of the simulations (and even more those that are statistically significant) show a greater advancement of the date of the last frost than of the date of budburst, which means that the risk should decrease in the future. This figure gives a first raw idea of the results but lacks details. However, the effect of warming scenarios is already visible. It seems that the stronger the warming, the more the risk should decrease.
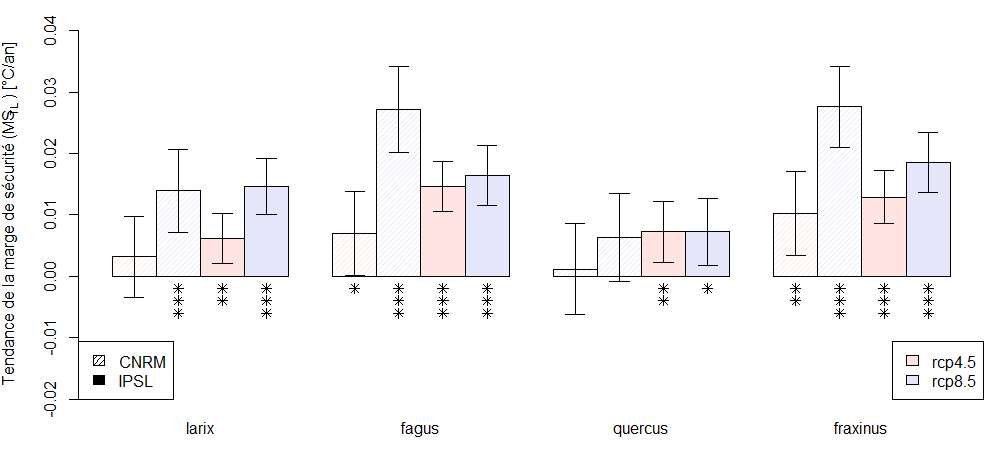
Next comes the evolution of the safety margin for the future, all locations combined, for the period 2006-2100 and distinguished by model, warming scenario and species. The whiskers represent the 95% confidence interval. Stars indicate level of significance: (p-value) *** < 0.001 < ** < 0.01 < * < 0.05. In addition to the previous results, it is clear that climate models are also responsible for uncertainties (the CNRM model projects a stronger decrease in risk than the IPSL model for the RCP 8.5 scenario for instance). The species effect is also important but should be carefully considered for the reasons detailed in the thesis and related with the model validation previously mentioned.
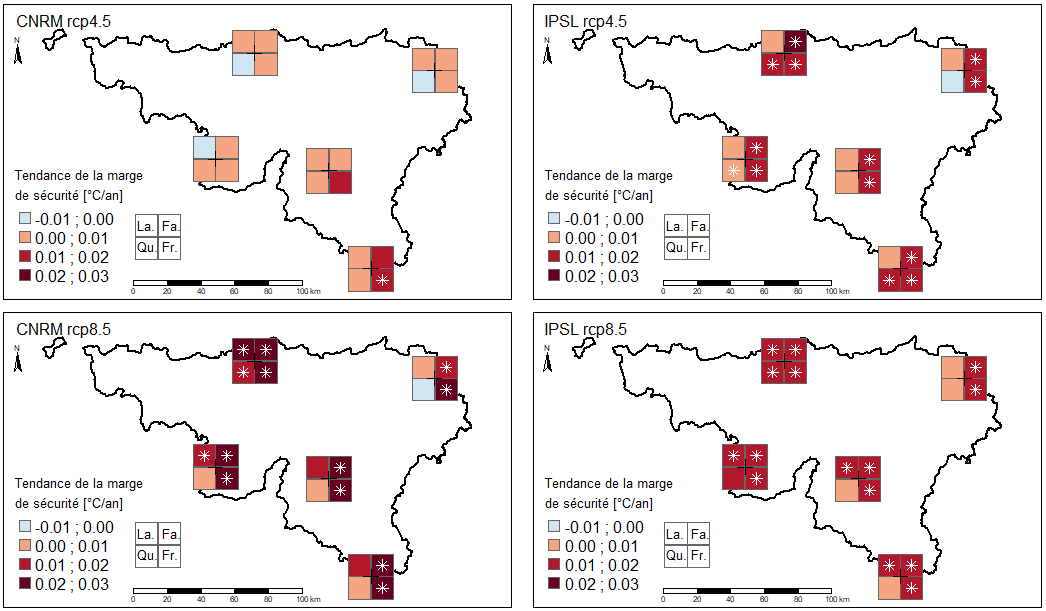
Finally, the following maps make it easy to assess the effect of each variability factor (models, scenarios, species and locations). These maps indicate the safety margin trend [°C/year] for five different locations. It seems that the effect of location is weak compared to the other variability factors. The most important result is the fact that no simulation showed a significant downward trend in the safety margin. The simulations are either significantly positive (decreasing risk) or nonsignificant. In the end, in our regions, forest late frosts are and should remain very rare and localized events in the future. It is unlikely that the climate change will have an effect on late frosts, the direction and amplitude of which should worry Walloon foresters.